SpamVisualization.net
A Single Function SiteDescription:
SpamVisualization.net is a super cool way of analyzing and visualizing comments and trackbacks spam from a database called Spam Catalog.
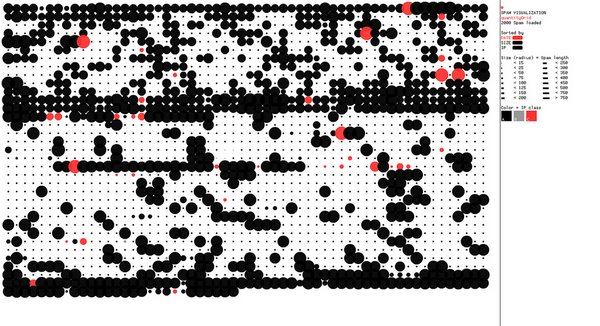
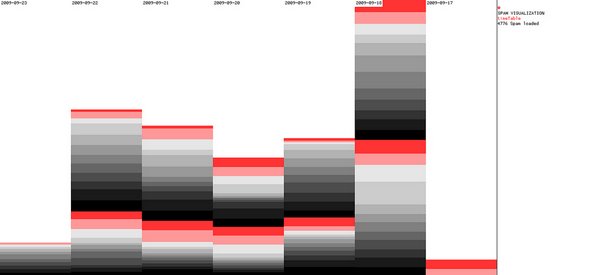
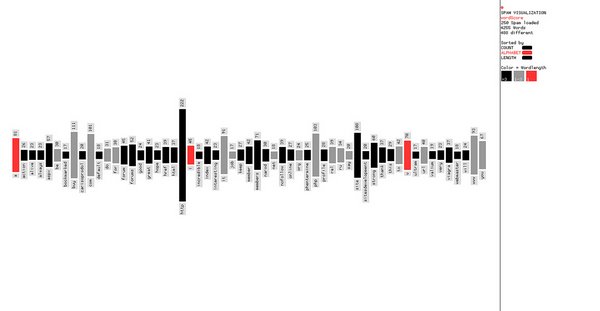
6 different visualizations exist, and they are dynamically updated with the latest state of the Spam Catalog. Make sure to check them out, they are definitely worth looking at. Here is the a peek:
quantityGrid – Size of the last 2.000 Spam
timeTable – Daily Spam amount
wordScore – Used words in the last 250 Spam
Images Source: Flickr
And here’s the full list of the visualizations:
- quantityGrid – Size of the last 2.000 Spam
- wordScore Used words in the last 250 Spam
- toplevelCircle – Domain endings of 1.000 Spam
- ipQuadrangle – IP address of 1.000 Spam
- timeTable – Daily Spam amount
- basicShape – All data cube chain
SpamVisualization.net is the creation of Kim Asendorf.
To learn about what is new from SpamVisualization.net, simply follow the updates on Twitter @kimasendorf.
Suggested by: Alex G.


 (7 votes, average: 4.14 out of 5)


5 Comments
swan
January 2nd, 2010 at 7:33 am
http://www.statsmogul.com/www.mailworks.org – please take a look if you’re interested in spams
opensim viewer
July 17th, 2010 at 4:46 pm
Nice website, thanks for sharing with us!
Logotipo
July 24th, 2010 at 6:22 pm
Great Job!
Keshab raj
December 22nd, 2010 at 3:59 am
where is my website? I’d submitted http://www.clearwebstats.com more then 2 times but no response. so sad ..
chefville cheats
October 17th, 2012 at 1:32 pm
Great post. I used to be checking constantly this blog and I’m impressed! Very useful information specially the remaining part 🙂 I care for such info much. I used to be seeking this particular information for a long time. Thanks and best of luck.